
Dawson Public Power District General Manager Gwen Kautz.
By Gwen Kautz, General Manager
gkautz at dawsonpower.com
308-324-2386
The folks at Dawson Public Power District work hard to keep the lights on and get them back on quickly when there are problems. There is another side of the business though, where we work equally hard – and that is finding efficiencies in our operations to provide your electricity in a cost-effective and proficient manner. Therefore, public power works well for all of us.
Providing electricity is a very capital-intensive endeavor, meaning that the infrastructure we have in place to serve you costs a great deal of money, both to construct and to maintain. Most of your bill goes for this purpose and Dawson PPD works hard to make sure we are doing so prudently. Our aging conductor program increases the robustness of the system to minimize outages during storms and provide a stable product each time you turn the light switch on or start a motor.
We continually benchmark ourselves, on many items, including other electric utilities to make sure we’re doing the best we can. Dawson PPD is a cost-based, not-for-profit utility. This means the District’s rates cover the cost of providing you service, with any additional revenue being reinvested into the infrastructure.
Recently, I ran across some interesting statistics about how much revenue is collected per mile of installed infrastructure with various utilities across the nation.
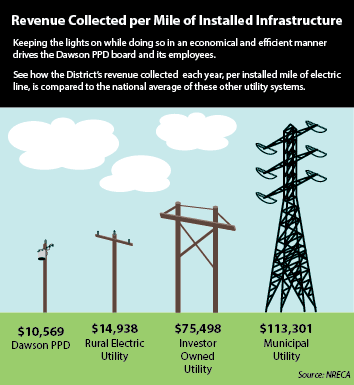
Dawson PPD collects, and requires, $10,569 per installed mile of infrastructure, per year, to provide you with electricity. The national average for a rural electric utility is $14,938 per mile per year. Investor owned (for-profit) utilities collect $75,498 per year per mile to provide service. Municipal systems, such as those found in smaller towns and cities, typically collect $113,301 per mile per year for their installed infrastructure. These statistics give me confidence that we are doing pretty good in keeping the lights on while doing so economically and efficiently.
Electric distribution spending is affected by the number of customers served, the amount of electricity sold, the number of miles of electric distribution installed, and the maximum amount of load on the lines at one time (peak). These costs have been increasing faster than the growth of any of the other variables.
Good is never good enough, though. Dawson PPD continues to look at ways to improve all areas, but especially in efficiency. We look primarily at two reports put out annually. One is called a Key Ratio Trend Analysis, and the other is by the Energy Information Administration. KRTA reports come from 813 rural electric utilities, while the EIA uses nationwide data. There are 145 metrics analyzed in the KRTA. Numbers shown below for Nebraska and the United States are median (median is the middle point of a number set).
Let’s make some easy comparisons to demonstrate the value of data.
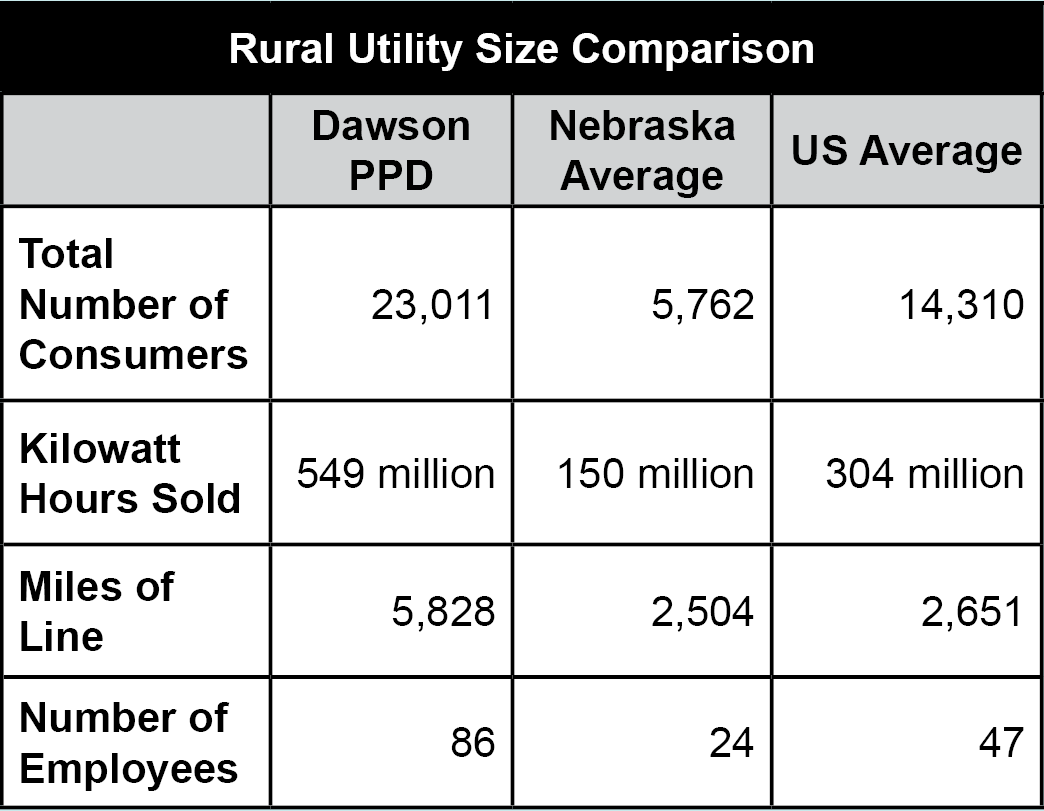
As you can see, your power district is one of the larger rural systems not only in Nebraska, but also in the United States. If you look at miles of line, out of 813 systems reporting nationwide, Dawson PPD ranks 89th.
The reason it’s important to consider one ratio in relationship to others is that the number of consumers per mile of line directly affects electric revenue and total cost of electric service.
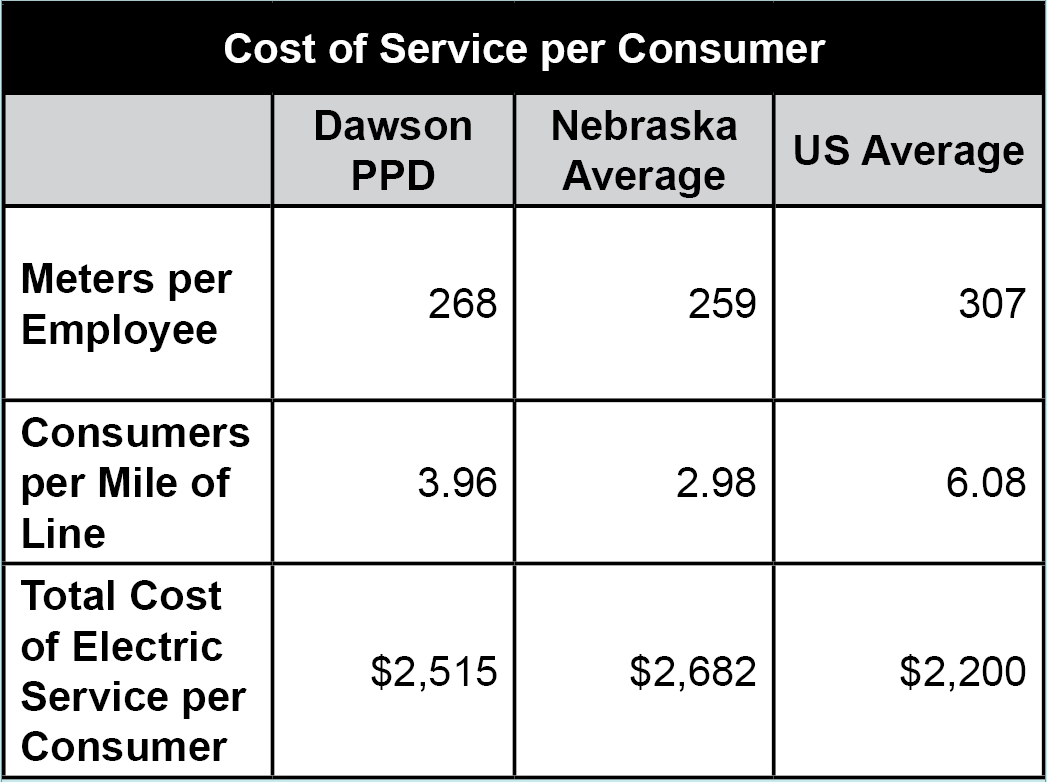
If efficiency is a goal, the aspect of reliability must be held above that. After all, what good is being efficient if you can’t deliver the power? It’s such a tenuous balancing act! Your directors understand the importance of both.
October 2018
